Lift and Drag Concepts
Factors that affect lift and drag can be expressed in the following formulas:
Lift = CL × ½ pV2 × S
Drag = CD × ½ pV2 × S
In these formula,
CL = lift coefficient (angle of attack)
CD = drag coefficient
S = the plan area (or wing area) of an airfoil
V= the TAS or an aircraft’s velocity squared
p = the density of the air.
Don’t be alarmed by the esoteric appearance of these formulas. Coefficient simply means a value that is constant or predictable, and in this case it is by virtue of the shape and design of the airfoil—the coefficient (whether for drag or lift) will vary with the angle of attack of the airfoil. Therefore, think of CL or CD as “angle of attack”. Note, however, that the rest of the equation is the same for both lift and drag, and further note that air density and TAS, and wing area are concepts which you are likely already familiar with. So what is the big deal with these formulas? The answer is this: V2. Lift and drag increase exponentially with speed—if speed is doubled, drag or lift will be quadrupled. In contrast the relationship between lift or drag and air density is a direct relationship such that an increase or decrease in air density will cause an increase or decrease in both drag and lift.
The relationship between drag and speed is of special interest with respect to the concepts of flight for maximum endurance (VME) and maximum range (VMR), as well as the concept of slow flight.
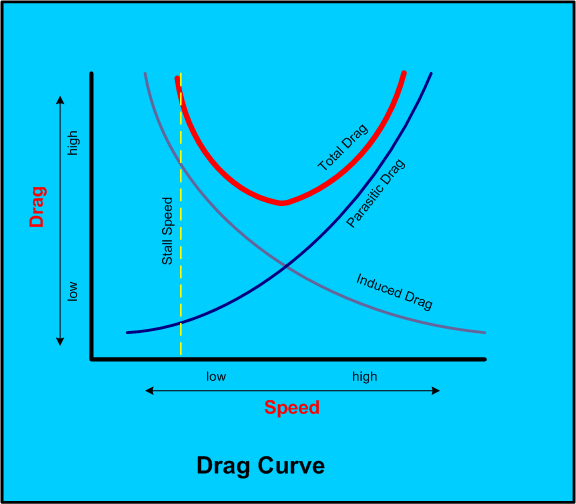
As speed increases, parasitic drag increases exponentially, and as speed decreases, induced drag increases exponentially. This is referred to as the drag curve.

At the bottom of the drag curve—that is, the position at where drag is at the combined minimum value—is the speed for maximum range—i.e., the speed at which the maximum amount of speed (or distance) is obtained per unit of fuel.
To decrease speed from VMR would increase fuel consumption as a result of increased induced drag, while to increase speed from VMR would increase fuel consumption as a result of increased parasitic drag.
The bottom of the drag curve is the most efficient speed at which the airfoil can generate maximum lift and minimum drag—this is the speed at which you will maximum-distance glide. If you were to express lift and drag as a ratio, this position would be referred to as the maximum lift-drag ratio.
In contrast, we can also produce a curve—again relative to changes in speed—representing the minimum amount of power necessary to offset drag; this power curve would be quite similar in shape to the drag curve. The bottom of the power curve would be the maximum endurance speed (VME). If we could compare the two curves—power and drag—we would note that VME is slightly less that VMR. Flight between VME and VSO is the slow flight range.