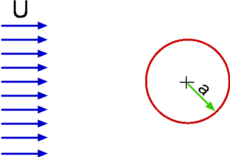
Flow Around a Circular Cylinder
Flow around a circular cylinder can be approached from the previous example by bringing the source and the sink closer. Then we are considering a uniform flow in combination with a doublet. The stream function and the velocity potential for this flow are given by,
Figure 4.28: Schematic for Flow past a Circular Cylinder
|
| |
|
| (4.104) |
Streamlines for this flow are plotted in Fig. 4.29.
|
Figure 4.30: Stagnation Points for Flow about a Circular Cylinder |
The velocity components are given by,
|
| |
|
| (4.106) |
It is seen that the radial velocity is zero when
|
If we recognise this particular streamline as the surface of the circular cylinder then the radius of the cylinder a is given by,
|
The equations for the streamline, velocity potential and the velocity components are replaced by,
|
| |
|
| (4.110) |
|
| (4.111) |
|
| (4.112) |
The velocity components on the surface of the cylinder are obtained by putting r = a in the above expressions. Accordingly,
|
![]() has a zero at 0 and 1800 and a maximum of 1 at
has a zero at 0 and 1800 and a maximum of 1 at ![]() = 900 and 2700. The former set denotes the stagnation points of the flow and the later one denotes the points of maximum surface velocity (of magnitude
= 900 and 2700. The former set denotes the stagnation points of the flow and the later one denotes the points of maximum surface velocity (of magnitude ![]() ). Thus the velocity decreases from a value of
). Thus the velocity decreases from a value of ![]() at
at ![]() equals 900 to
equals 900 to ![]() as one moves away in a normal direction s shown in Fig 4.30.
as one moves away in a normal direction s shown in Fig 4.30.
The surface pressure distribution is calculated from Bernoulli equation. If we denote the free stream speed and pressure as ![]() and
and ![]() we have
we have
|
Substituting for  , we have
|
We can also express pressure in terms of pressure coefficient, Cp,
| |
leading to |
|
| (4.117) |
Fig. 4.31 shows Cp plotted as a function of ![]() . A symmetry about y -axis is apparent. When compared to the experimentally observed Cp
. A symmetry about y -axis is apparent. When compared to the experimentally observed Cp
distribution we see that there is some agreement in the region between![]() = 00 and
= 00 and ![]() = 900 . But any agreement is lost in the other regions. The reasons for this are obvious. Viscous forces dominate the flow in the region to the right of the centreline giving rise to separation. The pressure tends to plateau out in a separated region, the level depending on whether it is a laminar separation or a turbulent one.
= 900 . But any agreement is lost in the other regions. The reasons for this are obvious. Viscous forces dominate the flow in the region to the right of the centreline giving rise to separation. The pressure tends to plateau out in a separated region, the level depending on whether it is a laminar separation or a turbulent one.
Figure 4.31A: Cp distribution for flow past a circular cylinder. |
Figure 4.31B: Cp distribution for flow past a circular cylinder plotted around the cylinder. |
Symmetry in the theoretical Cp distribution about both y-axis and x-axis shows that drag and lift forces about the cylinder are each zero. This
may also be proved by integrating pressure around the cylinder, thus,
Drag, | |
Lift, | (4.119) |
By substituting for the surface pressure, ps from Eqn.4.115 we find,
|
| |
|
| (4.121) |
| = -0 -0 + 0 | (4.122) |
|
| (4.123) |
|
| (4.124) |
| = -0 -0 + 0 | (4.125) |