Construction of Bode Plots
Rules for Construction of Bode Plots
Follow these rules while constructing a Bode plot.
· Represent the open loop transfer function in the standard time constant form.
· Substitute, s=jω in the above equation.
· Find the corner frequencies and arrange them in ascending order.
· Consider the starting frequency of the Bode plot as 1/10th of the minimum corner frequency or 0.1 rad/sec whichever is smaller value and draw the Bode plot upto 10 times maximum corner frequency.
· Draw the magnitude plots for each term and combine these plots properly.
· Draw the phase plots for each term and combine these plots properly.
Note − The corner frequency is the frequency at which there is a change in the slope of the magnitude plot.
Consider the open loop transfer function of a closed loop control system
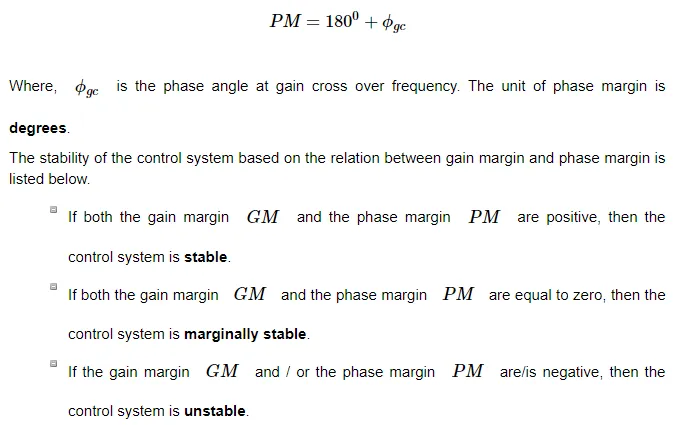
From the Bode plots, we can say whether the control system is stable, marginally stable or unstable based on the values of these parameters.